The Overview report provides a high-level summary of any domain’s performance across AI search, organic search, paid search, and backlink authority.
You can quickly evaluate visibility in both AI platforms and classic Google SERPs with AI-specific metrics, citation insights, and geographic distribution data.
Use this report to analyze competitors, measure your own market position, and track both traditional SEO and AI-driven visibility.
Getting Started
First, decide whether you want to view data for the entire domain, a specific section, or an individual page.
Enter your target in the search bar:
- Root Domain (example.com): Shows data for the entire domain
- Exact URL (example.com/about-us): Shows data for a single page
- Subdomain (blog.example.com): Shows data for a specific subdomain (a specific section)
- Subfolder (example.com/blog/): Shows data for a specific section of the site

The metrics in the report automatically adjust based on what you choose to analyze.
Additionally, you can filter the report by specific dimensions, such as country, device type, or date range, to focus on the exact market and time period that matter most for your analysis.
The report is split into multiple sections. Let's look at each section and what data you'll find there.
Top Metrics Overview
The top of the report displays key metrics that give you a quick overview of the domain's overall search performance.
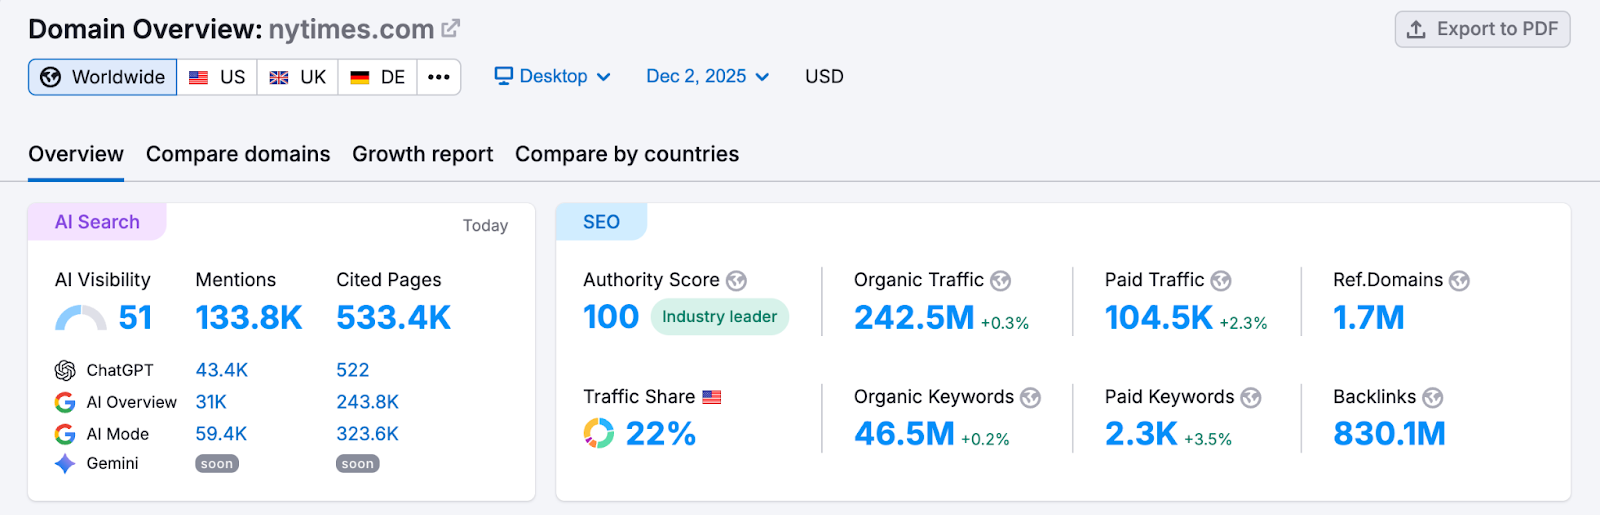
1. AI Visibility
AI Visibility gives you an idea about a domain’s performance in AI search results. You’ll see:
- AI Visibility Score: Measures the brand's presence in AI-generated answers compared to competitors
- Total Mentions: Shows how many times the brand is mentioned in AI-generated answers
- Cited Pages: Shows the pages on the domain that are cited most often by AI search results
Click the numbers to open the full Visibility Overview report for deeper analysis.
2. Authority Score
Authority Score is a metric developed by Semrush that measures the overall quality, trustworthiness, and SEO strength of a website. The score ranges from 1 to 100. The higher the Authority Score, the more likely the domain is to rank well in search results and pass valuable SEO authority when linking to other sites.
Note: Authority Score is a domain-level metric and can also … individual pages, but not subfolders or subdomains. If you're analyzing a subfolder or subdomain, you'll see the root domain's Authority Score.
3. Organic Search Traffic
Organic search traffic is the estimated number of visitors the domain receives from unpaid search results each month.
The percentage next to the traffic number shows how this traffic has changed compared to the previous period. Click "View details" to open a detailed report that shows which keywords gained or lost rankings.
4. Paid Search Traffic
Paid search traffic is the estimated traffic the domain receives from paid search ads each month.
Click the number, and you'll see a detailed report showing all the keywords the domain is bidding on, along with the amount of traffic each keyword generates.
5. Ref.Domains
Ref. Domains (Referring Domains) metric represents the total number of unique domains that have at least one backlink pointing to the analyzed domain.
6. Traffic Share
Traffic share is what percentage of organic traffic this domain captures compared to its main competitors. A higher traffic share means the domain is winning more visibility than competitors. Click to view a detailed competitor comparison.
7. Organic Keywords
Organic Keywords are keywords that are currently attracting users to the analyzed domain via Google's top 100 organic search results.
8. Paid Keywords
Paid Keywords are the keywords that a domain is actively bidding on in advertising platforms (like Google Ads) and which subsequently drive estimated user traffic to that domain via Google's paid search results.
9. Backlinks
Backlinks are links from other websites pointing to this domain. They're incredibly important from a ranking standpoint. Generally, the more backlinks you have, the better. You can click on the number to see the exact pages linking to the domain.
After reviewing the top metrics, scroll down to explore more details about the domain’s performance
Traffic Sources and Trends
The Traffic Sources and Trends section helps you understand where a domain’s visibility is coming from and how its performance is evolving over time across both AI search and traditional Google search. This area highlights geographic distribution, long-term traffic patterns, branded search behavior, and the domain’s presence within Google SERPs.
Together, these insights reveal not only how users find the site today, but also which markets and search channels are driving momentum—or signaling emerging opportunities or risks.
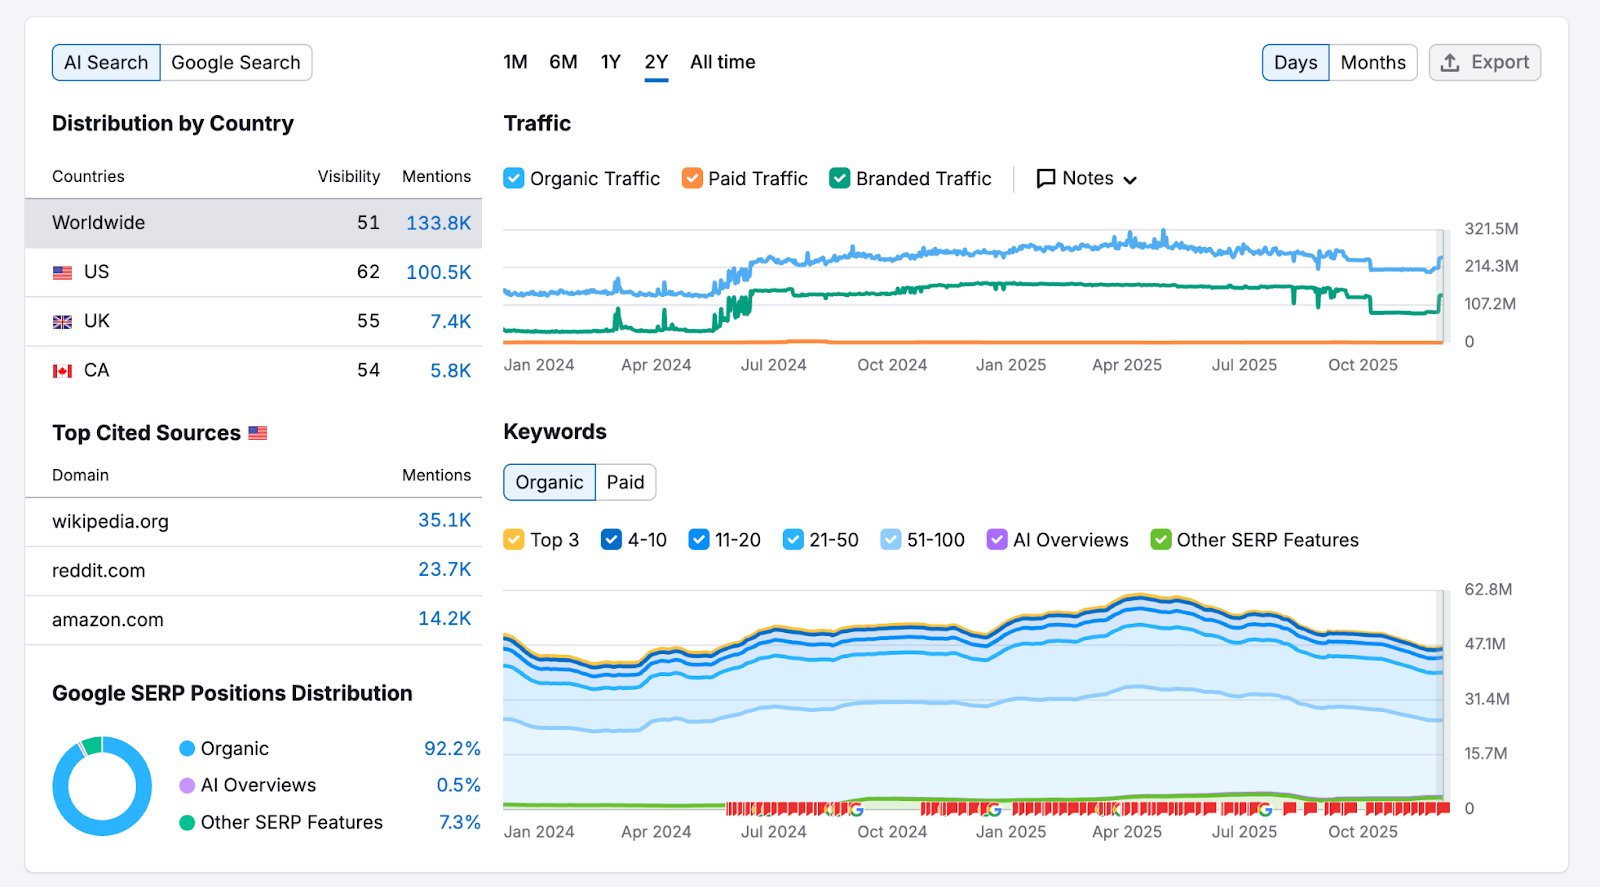
1. Distribution by Country
This widget shows which countries generate the most organic and paid search traffic for the domain. Each country is displayed with its percentage of total traffic and the actual traffic numbers. This widget supports both AI platforms and Google, allowing side-by-side geographic performance comparisons.
This data is valuable for competitive research. If you see a competitor dominating in a specific country, it signals they've invested in that market through international SEO or targeted ad campaigns.
Note: This widget shows data at the root domain level only. If you're analyzing a subfolder, subdomain, or URL, you'll still see traffic distribution for the entire domain.
2. Top Cited Sources
This widget highlights the main citation sources used by AI platforms for the analyzed domain.
This data helps you quickly identify which external sources contribute most significantly to a domain's presence in AI-generated answers.
3. Branded vs Non-Branded Traffic
See the split between branded and non-branded organic traffic in Google search. This reveals how dependent the domain is on brand recognition versus their ability to rank for general topic keywords.
A healthy mix typically includes a balanced combination of branded and non-branded traffic.
4. Google SERP Positions Distribution
This widget breaks down the share of the domain's Google search performance across organic results, AI Overviews, and other SERP features. This calculation is based on Google's top 100 organic search results.
5. Organic Traffic Trend
This graph shows the domain's estimated monthly organic traffic over your selected time period. Watch for upward trends (successful SEO execution), downward trends (potential issues or increased competition), or sudden spikes and drops (which often correlate with algorithm updates, site migrations, or big content changes).
Unlike the Distribution by Country widget, this graph adjusts when you analyze a subfolder, subdomain, or URL. This lets you track how specific sections of a competitor's site perform over time.
6. Organic Keywords
This graph shows how many keywords the domain ranks for and how that number changed over time. You'll also see a breakdown showing how keywords are distributed across different ranking positions—like top 3, positions 4-10, and 11-20. This helps you understand whether the ranking positions are improving or not.
Organic Research
This section breaks down everything about the domain's organic search presence—from their top-performing keywords to their main competitors. All widgets in this section adjust automatically when you analyze a specific URL, subfolder, or subdomain, letting you focus on particular areas of a site.

1. Top Organic Keywords
See the domain's top five keywords that send the most organic traffic. For each keyword, you'll see:
- Traffic %: The percentage of total organic traffic this keyword generates
- Intent: The search intent behind those keywords (informational, transactional, commercial, and navigational)
- Position: Where the domain ranks for this keyword
- Volume: How many people search for this keyword monthly
- CPC: How much advertisers pay per click for this keyword
2. Key Topics
Key Topics shows which topics drive the most traffic to the analyzed domain. Topics shown here exclude branded keywords (searches that include the company name), so you see what general topics attract visitors.
3. Keywords by Intent
This graph categorizes all the domain's ranking keywords by their search intent:
- Informational: Users are looking for information or answers
- Navigational: Users are trying to reach a specific website
- Commercial: Users are researching products or services before buying
- Transactional: Users are ready to make a purchase or take action
4. Organic Position Distribution
See how your domain's rankings are spread across different position ranges. The chart displays the number of keywords where your domain ranks in positions 1-3, 4-10, 11-20, 21-50, 51-100.
Domains ranking in the top 3 positions have greater visibility. A distribution leaning toward lower positions (21+) indicates potential for improvement.
5. Main Organic Competitors
View the domain's top organic competitors, ranked by how similar their keyword portfolios are. The more keywords two domains share, the more directly they compete.
The table shows:
- Common Keywords: Keywords both domains rank for
- SE Keywords: Total keywords each competitor ranks for
Click a number in the Common Keywords column to compare the domains side-by-side. Or click "View details" to open the full competitor list.
6. Competitive Positioning Map (Organic)
This visual map displays the analyzed domain alongside competitors, based on two metrics: the number of ranking keywords and estimated traffic.
Each competitor is represented as a bubble—larger bubbles signify greater visibility. Use this to quickly spot the big competitors (large bubbles near the top-right) and smaller players (bubbles in the bottom-left).
After assessing organic search performance, next up evaluate the paid advertising section
Paid Research
This section shows everything about the domain's paid search campaigns—which keywords they're bidding on, how they rank in paid results, and who they're competing against. Like the Organic Research section, all widgets adjust when you analyze a specific URL, subfolder, or subdomain.
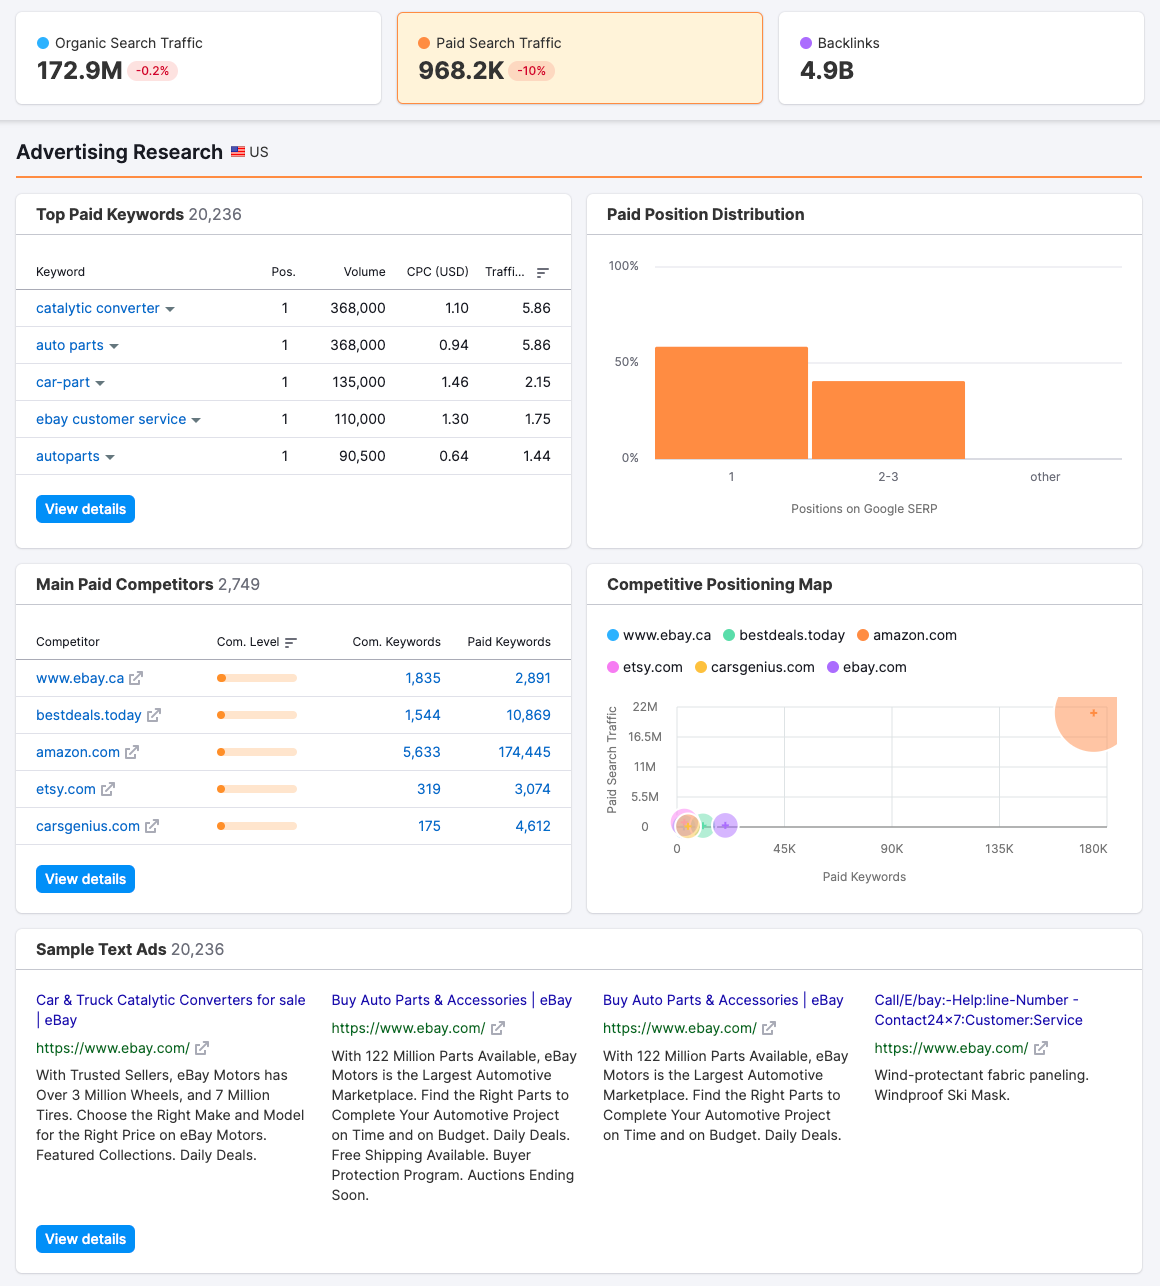
1. Top Paid Keywords
See the domain's top five paid keywords, ranked by how much traffic each brings from ads. Traffic percentage shows what portion of ad clicks come from each keyword.
Click "View details" to open the complete list of keywords the domain bids on.
2. Paid Position Distribution
This chart shows where the domain's ads appear in search results—positions 1, 2-3, or lower. More ads in top positions (1-3) indicate that the bids are competitive and the ads have high-quality scores.
3. Main Paid Competitors
View the domain's top five paid search competitors, ranked by keyword overlap. The table shows how many paid keywords they share and each competitor's total ad keywords.
Click a number in the Common Keywords column to compare domains side-by-side. Or click "View details" to see all the competitors.
4. Competitive Positioning Map (Paid)
This visual map plots competitors based on their paid search visibility. Larger bubbles indicate domains with greater paid search visibility. Use this to identify the biggest PPC spenders and most aggressive paid search competitors in your industry.
5. Sample Text Ads
See actual ad copies the domain is currently running. These samples show how they're messaging their offerings and what value propositions they emphasize.
Click any ad to visit its landing page and experience the full user journey. Click "View details" to see all the ads Semrush identified in the past month for the domain.
Finally, you’ll see the backlinks section.
Backlinks
This section features the backlink-related data for the domain, including who's linking to it, the types of links pointing to the domain, and which pages attract the most links. These widgets also adjust when you analyze a subfolder, subdomain, or specific URL.
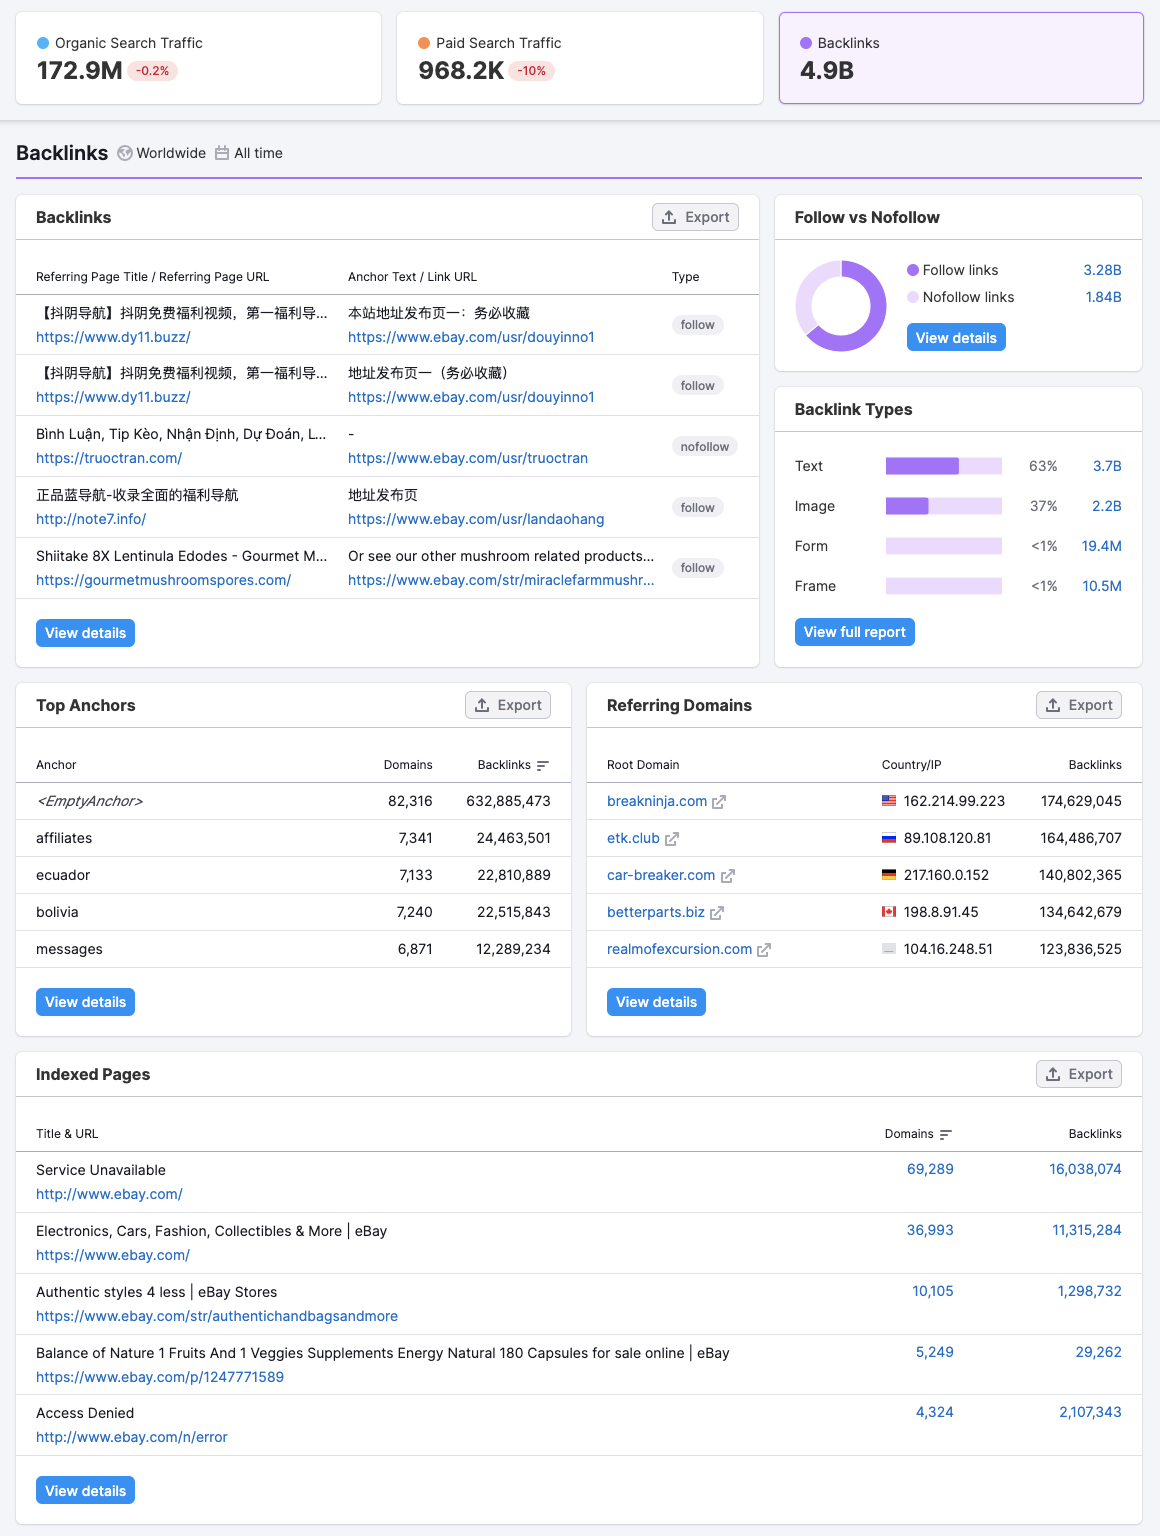
1. Backlinks
Get a quick overview of the pages linking to the domain, including the anchor text used, the target page of the link, and the link type (follow vs nofollow). Click "View details" to open the full backlinks report, where you can filter and analyze links by Page Authority Score, link type, and more metrics.
2. Follow vs. Nofollow Links
This chart shows the ratio of follow links to nofollow links pointing to the domain:
- Follow links are standard hyperlinks that pass SEO authority to the target site, helping it rank better
- Nofollow links contain a special HTML attribute (rel="nofollow") that tells search engines not to pass authority. While nofollow links don't directly boost SEO, they can still drive referral traffic.
A natural backlink profile typically contains both types.
3. Backlinks Types
See the breakdown of link types in the backlink profile:
- Text links: Standard clickable text (most common and valuable for SEO)
- Image links: Clickable images
- Form links: Links within form elements
- Frame links: Links within iframes
4. Top Anchors
View the five most common anchor texts (the clickable text) used in backlinks to the domain. Anchor text reveals how other sites describe and reference the domain.
The table shows:
- Domains: How many unique domains use this specific anchor text
- Backlinks: Total backlinks with this anchor text
Click "View details" for the complete anchor text list.
5. Referring Domains
See the top domains linking to the analyzed site, ranked by how many backlinks each sends. Click any domain to open its Domain Overview report and evaluate its quality. Or click "View details" to see the full list of all domains linking to the site.
6. Indexed Pages
See which pages on the domain have attracted the most backlinks. This reveals what content resonates most with other sites and earns natural links. Pages with many backlinks often represent the domain's best, most linkworthy content.
Once you've analyzed the Domain Overview report, you can export the data or create custom branded reports to share with your team or clients.
Share the Data
You can share the data from the Domain Overview tool with your team members or clients to share findings or performance summaries.
Click the "Export to PDF" button at the top right to generate a PDF report. Once generated, you can:
- Send via email: Enter recipient email addresses to send the report immediately
- Schedule delivery: Set up recurring reports to be sent automatically on a daily, weekly, or monthly schedule
- Download: Save the PDF to your computer to share later or present in meetings
